In June 2022, Stitch Fix launched the Freestyle search feature, transforming how our clients discover styles that are tailored to their taste. Under the hood, personalized search is fulfilled by a pipeline of modular microservices. We designed the search system to be composable, making it easy to swap in new components and speeding up experimentation and development. Composability also made the system more observable, making it simpler to make each event traceable and reproducible with built-in logging and metrics. However, even with extensive logging, debugging a complex system such as personalized search can be quite challenging.
As a hypothetical example, if a client searches for running shoes and instead sees paisley sweaters, we need to quickly diagnose where in the search pipeline the problem occurred, so that the experts in that system can work on a resolution. Where did the sweaters come from, and where are the shoes we expected to see instead? Did the query get parsed into incorrect attributes? Did the attributes get poorly matched with items in our inventory? Did the result rankings disproportionately focus on the client’s past preference for sweaters and disinterest in sportswear? Understanding which service is responsible for the problem is a crucial first step in addressing it. Ideally, we want to anticipate and prevent such problems through interrogating hypothetical search scenarios before clients encounter them.
Early on, we knew that slogging through system logs to understand bugs and dependencies of search would not sustain our need for iterative experimentation and collaborative development. To reduce toil and enhance the impact of the Search team, we invested in building a dedicated tool. Ariadne, named after the labyrinth expert from Greek mythology, is a custom interactive UI designed for search introspection. Ariadne is built with React and custom visualization components based on D3.js, visx, and internal libraries, and is powered by production and experimental search APIs. Developing alongside search, Ariadne has assisted our data scientists, engineers, UX researchers, designers, and product managers through launch, development, and continued experimentation.
In developing Ariadne, we have prioritized several capabilities needed to support and amplify the work of the Search team. In this article, we will show how Ariadne fulfills the following user needs:
- Provide a holistic view of the complete search pipeline from query to results;
- Make it easy to identify the pipeline component that is “responsible” for anomalous results;
- Explore search results visually and by comparing metric distributions;
- Focus on specific items and their journey through the search pipeline (e.g. if an expected item is not present in the search results, pinpoint where and why did it get blocked);
- Enable “what if” analysis by modifying the search query, client, pipeline configuration and settings, and/or specific inventory items.
Search pipeline from query to results
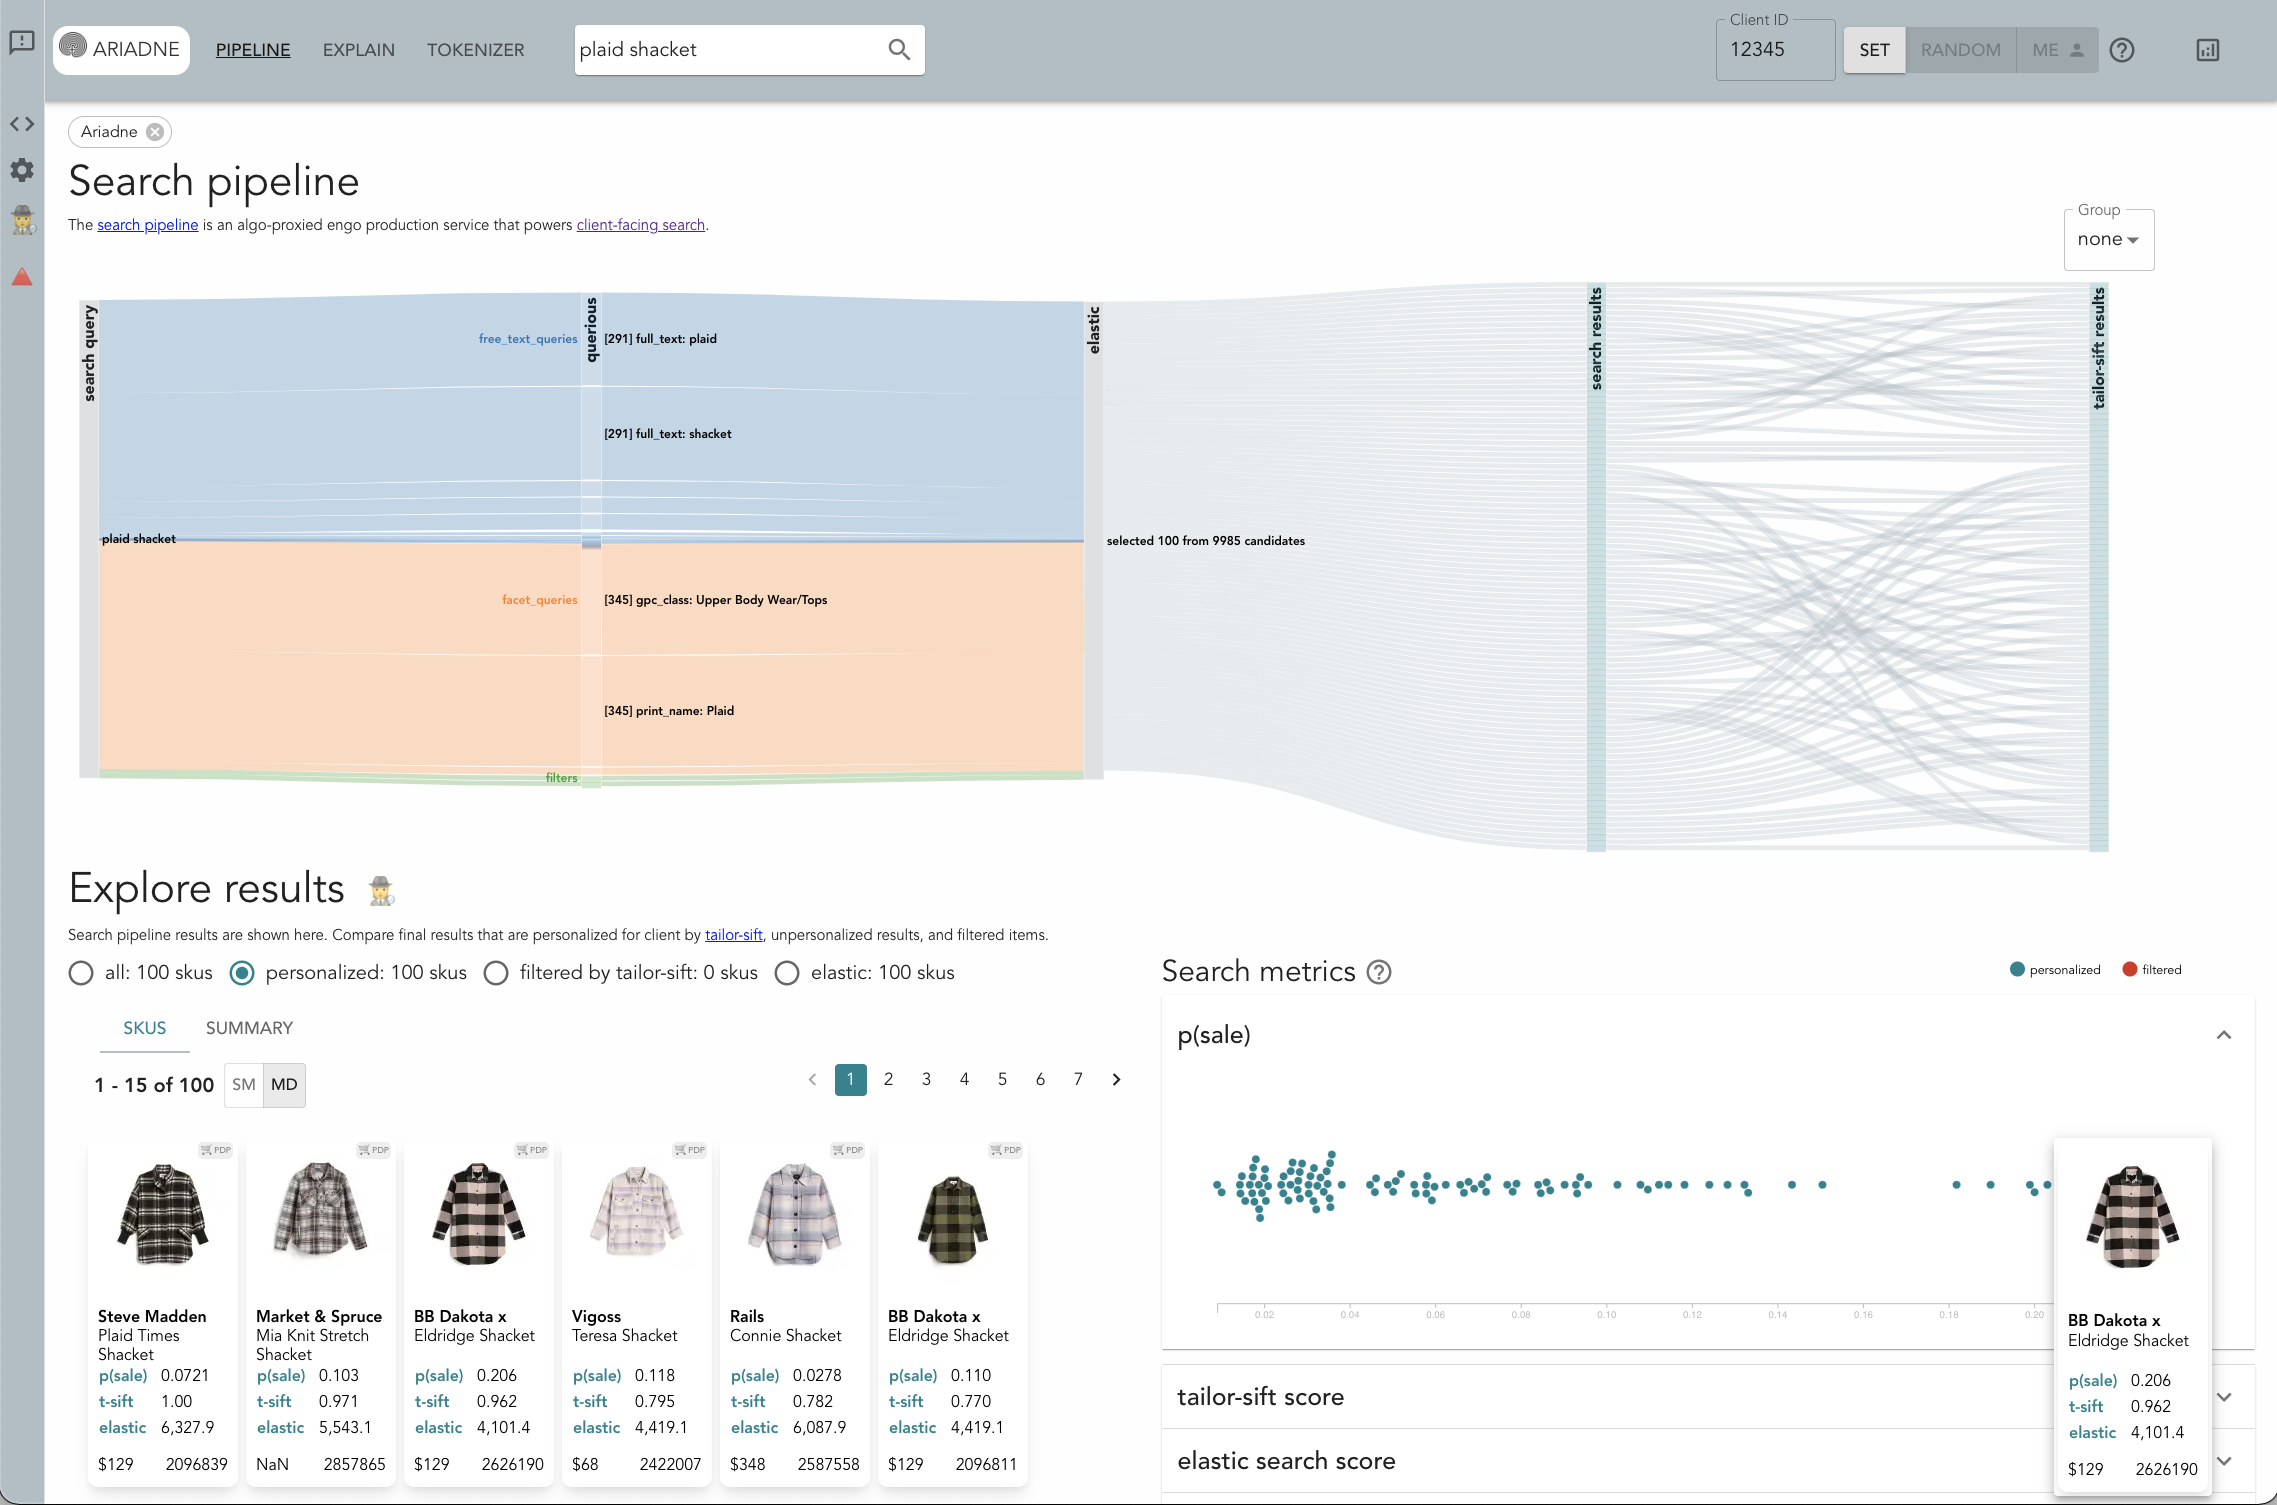
The Sankey (aka flow) diagram at the top of the landing page shows how the search query is handled by each service in the pipeline. When problems arise, this view helps diagnose which service in the pipeline is at the root of the issue. While we use many pipeline configurations at Stitch Fix, the basic pipeline is composed of three services: querious, the query parsing service, elastic, the core search engine backed by ElasticSearch, and tailor-sift, the personalized reranking service.
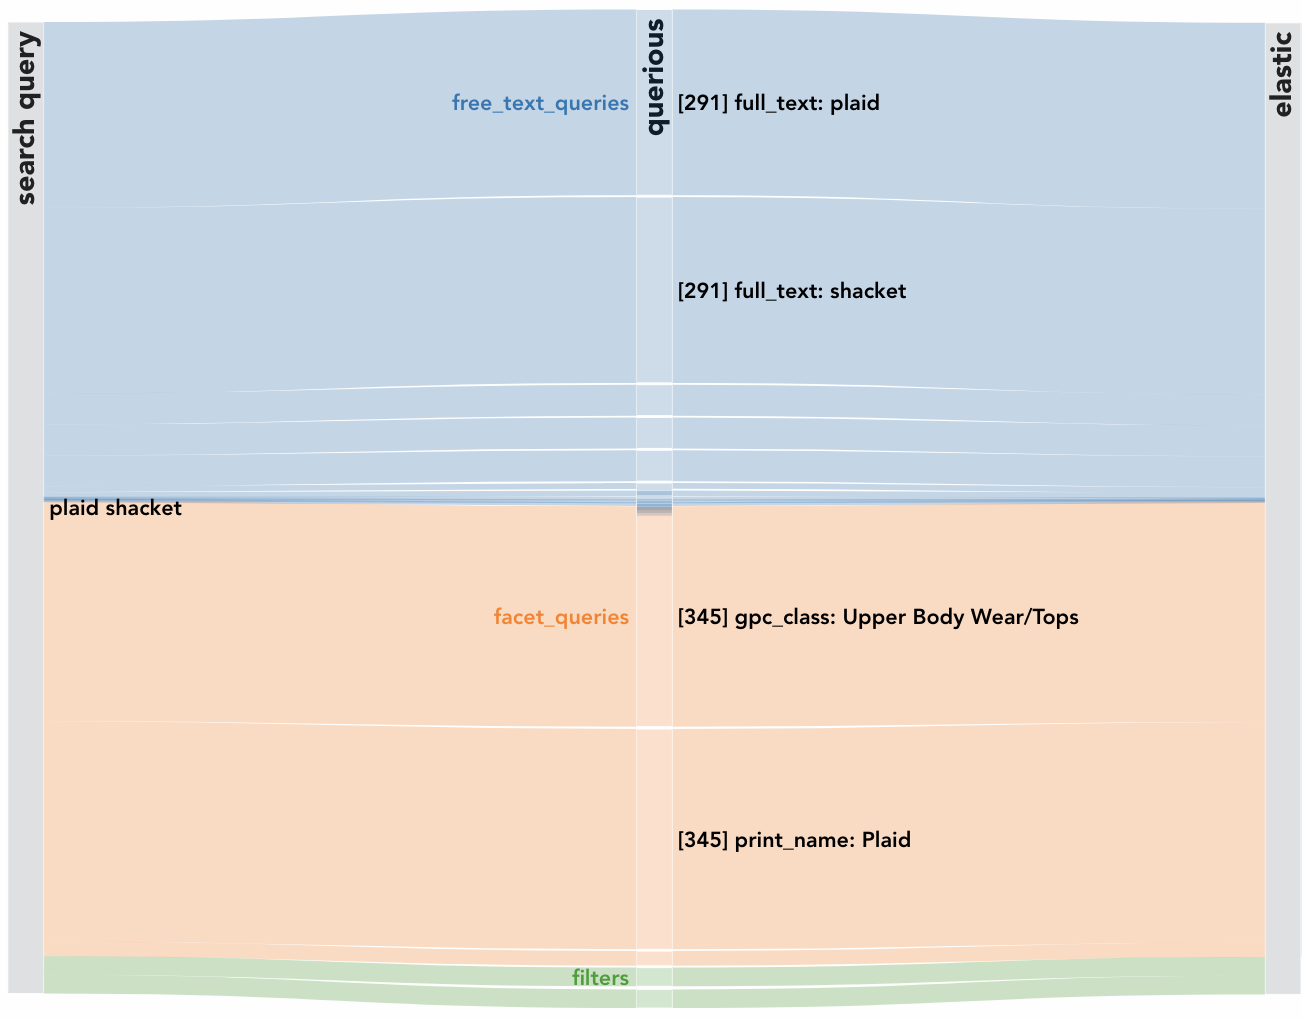
First, the search query “plaid shacket” is parsed by querious into weighted subqueries (named entities), e.g. “client comments: plaid”, “print name: Plaid”, “gpc class: Upper Body Wear / Tops” (“shacket” is a fashion term referring to a combination of a shirt and a jacket). The width of each link from the search query to each subquery represents the weight of the subquery. This section of the Sankey diagram helps identify unexpected or improper weighting or errors in named entity recognition. For example, if search results contained paisley sweaters and we saw “print name: Paisley” in this diagram with a high weight, that would indicate that querious improperly identified paisley, a wildly different print from plaid, as highly relevant.
Next, subqueries identified by querious are handed off to the core search engine, backed by ElasticSearch. The core search engine scores and ranks all items available in our inventory based on their correspondence to the weighted subqueries. The top items are then selected for personalization. These items are either shown in the diagram as individual nodes, or can be grouped by attributes such as color or product group. In the latter case, the link width indicates the number of items in each group, providing a quick gut check for an expected distribution of results. For example, if we saw many search results falling into the product groups “dresses” and “bottoms” while querious only weighted “upper body wear” highly, we would know that there is an issue with the core search engine rankings.
Finally, tailor-sift reranks the items selected by the core search engine. This reranking is uniquely tailored to each Stitch Fix client, relying on their past preferences and our algorithmic understanding of their style journey. Visual reordering of items in the Sankey diagram between the core search engine and tailor-sift illustrates how the search pipeline balances relevance and personalization. That helps reveal potential issues with the reranking algorithm. For example, if the order of the results were reversed, that would indicate an excessive bias towards personalization, potentially producing irrelevant results.
Exploring search results
At the bottom of the landing page, search results are displayed in several ways for further exploration. These visualizations are linked with each other and the Sankey diagram: selecting an item or subset of items in the pipeline visualization highlights these items in the result views, and vice versa. This linking speeds up analysis by allowing the user to focus on a small number of items from any view and simultaneously access information about these items across visualizations.
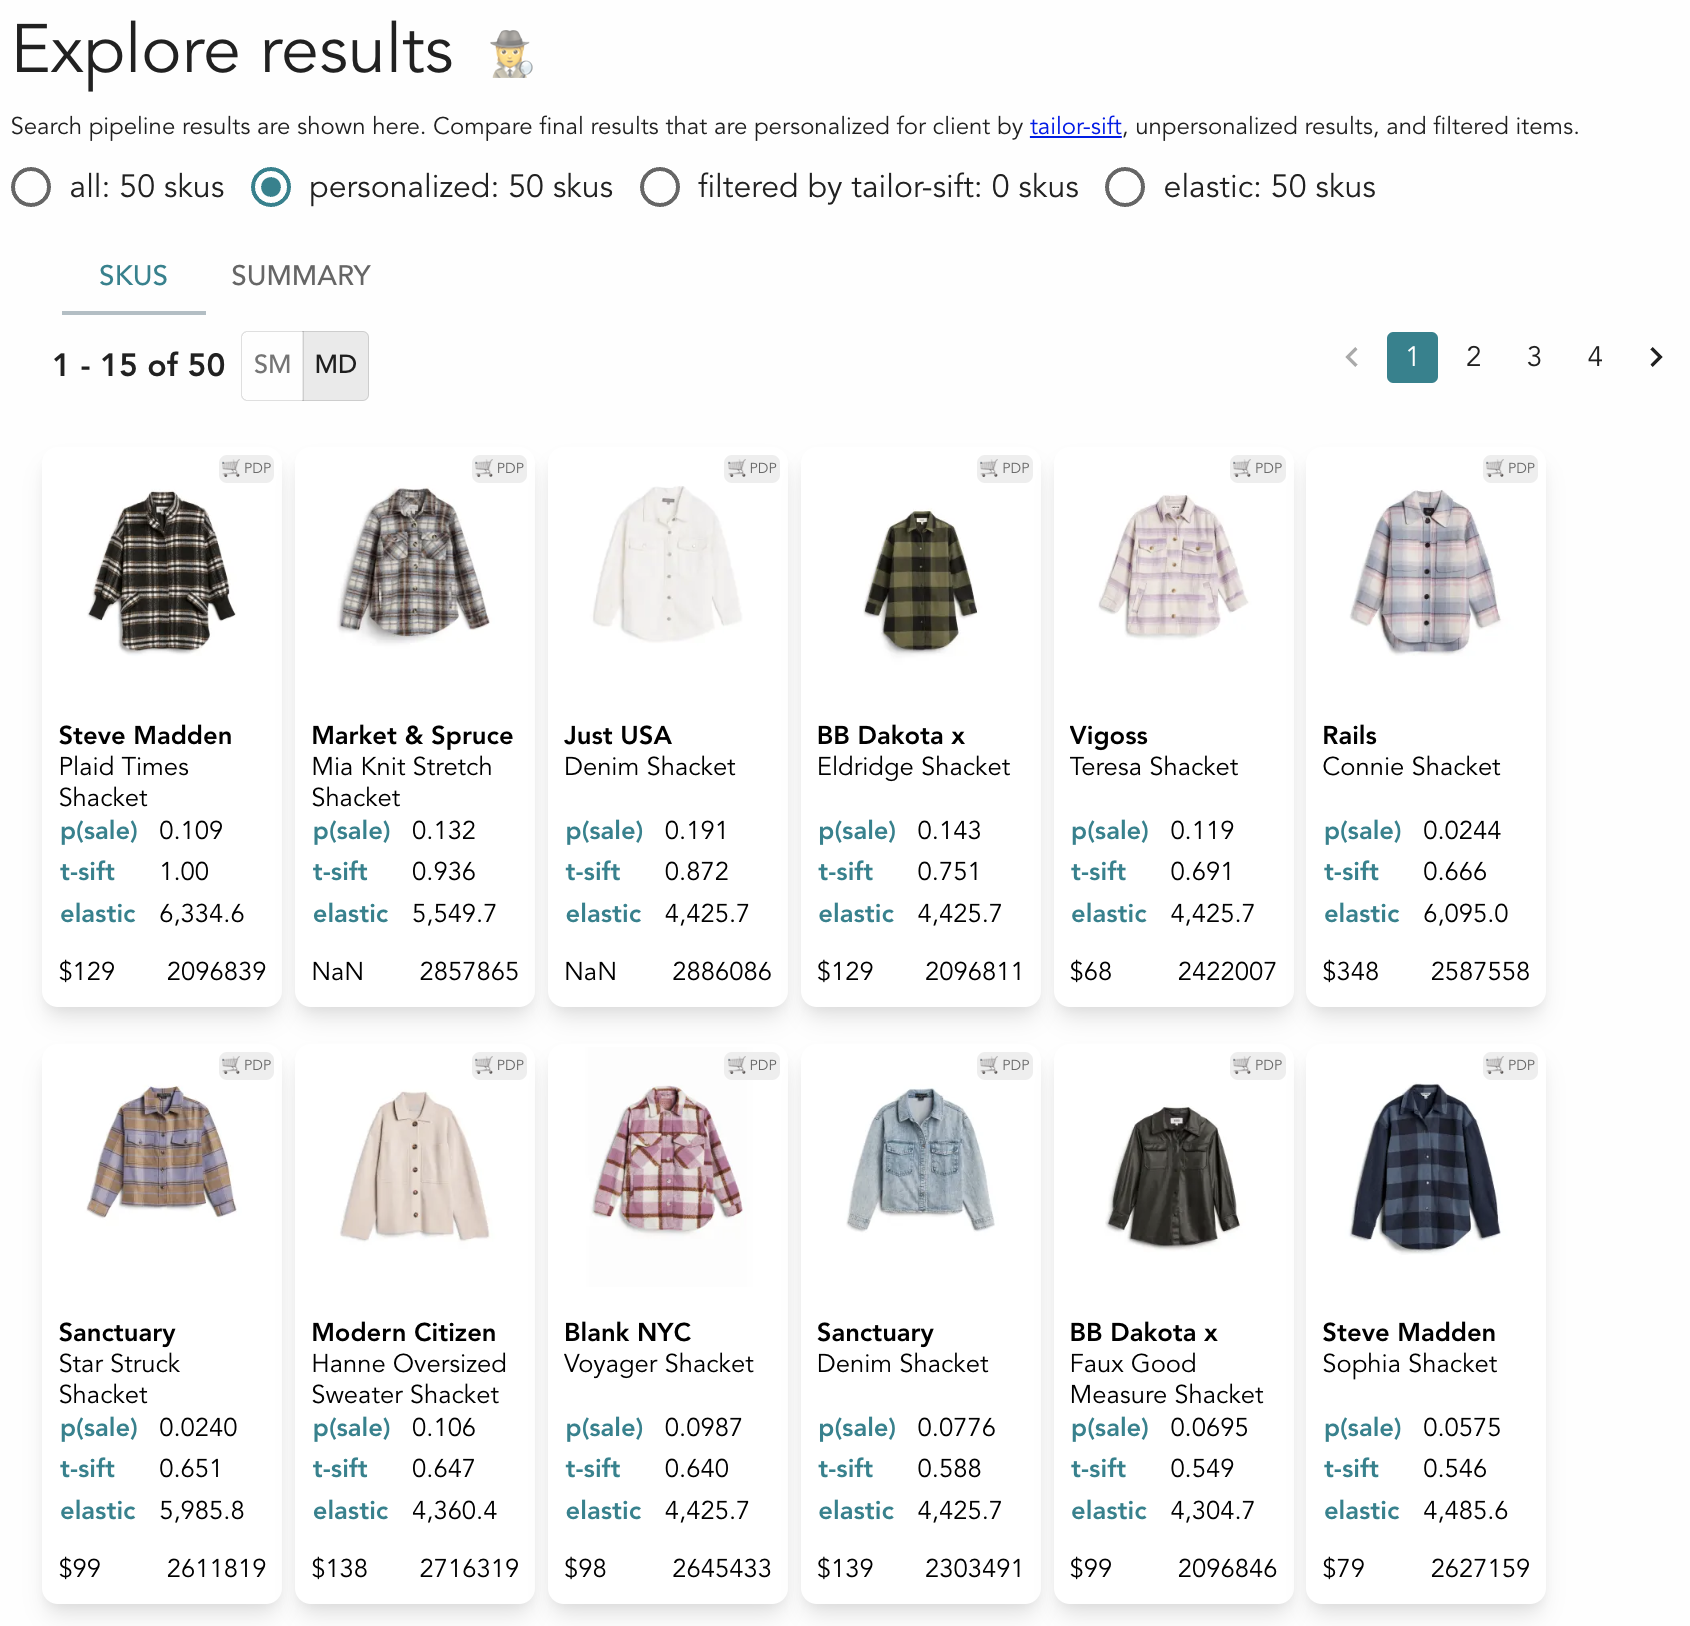
The first view of the search results is a tiled display of thumbnail cards with associated metadata and metrics computed by the search pipeline. Fashion inventory is visually rich, and the thumbnail display conveys a great deal of information, making outliers in color, print, or style readily apparent. The cards can be ordered by different metrics to understand how personalization affects the selection.
In the second view of the search results, metrics computed by the search pipeline for each item are displayed using beeswarm plots. Each dot corresponds to a metric for an individual item. Selecting an item highlights all metrics for that item, in addition to selecting that item in other visualizations. The distribution plots help identify anomalies in metric distributions. The plots reveal If any of the metrics were missing, skewed towards an end of the distribution, or clipped by improper data processing.
Deep dive: specific items in the search pipeline
Often, there is a specific item or small set of items that we would like to focus on when analyzing search results. For example, when expected items are not showing up in search results, we need to understand why the problem occurred. It is possible that these items have not appeared as candidates for the search results at all, that their relevance was scored incorrectly by the core search engine, or they were filtered out by personalized reranking. We can pinpoint the issue by comparing search metrics computed by each service for the items of interest.
In Ariadne, metrics for specific items or sets of items can be compared in a parallel coordinates plot. The plot shows either the full set of search results, items selected via other visualizations, or any custom set of items (not limited to those appearing in search results). In this view, it is easy to see where missing items have terminated their path through the pipeline. Additionally, metrics can be customized, addressing other analysis needs. For example, focusing solely on ranking metrics is helpful for understanding how well the search pipeline balances relevance with personalization.
While debugging and improving search, we often need to investigate how well the core search engine computes relevance for a particular set of items. The core search engine is backed by ElasticSearch and assigns a relevance score to each item paired with a subquery that was parsed from the search query. Ariadne displays contributions of each subquery and each item’s metadata to the item’s overall relevance rank in an interactive table. The table shows all search results by default, and any custom set of items can be substituted. This makes it easy to spot missing data, unexpected mappings between subqueries and results, and inappropriate weight assignments.
“What if” analysis and pipeline modification
Since launch, search has been undergoing active development. We often need to understand how different versions of the search pipeline affect results. Running “what if” analyses with different pipeline configurations, search queries, and test clients is essential for finding the best path for improvement. After launch, we added a capability to Ariadne to support this work by making the components of the search pipeline and their configurations fully modifiable. The modifications can be preserved in a lightweight store and shared with collaborators using an encoded url, which also encodes the search query and test client id.
Ariadne’s capabilities, co-evolving with specialized needs of the Search team, have supported development of personalized search at Stitch Fix beyond standard observability tools. Search is a highly collaborative and technically complex program, and its success relies on speed of iterative improvement, flexibility of experimentation, and ease of system management. Investment in building Ariadne, a dedicated observability UI, has amplified the work of the Search team by addressing these needs.
